
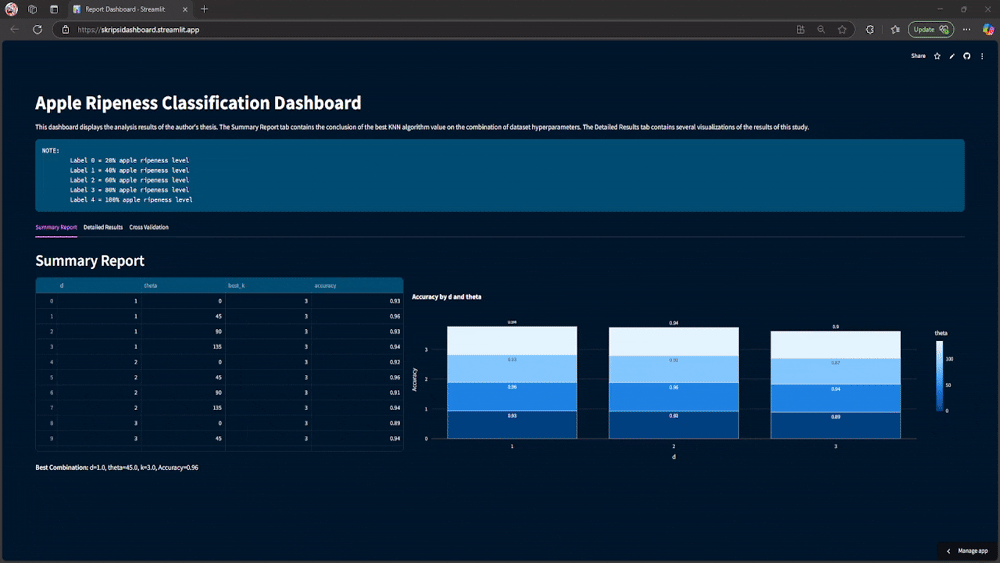
The Apple Ripeness Classification project was my thesis work aimed at bringing objective measurement to what is typically a subjective process in agriculture. This computer vision system utilizes Haralick texture features and the K-Nearest Neighbors (KNN) algorithm to precisely classify apples into five distinct ripeness levels (20%, 40%, 60%, 80%, and 100%).
By analyzing subtle changes in apple skin texture, the system achieves over 96% accuracy in distinguishing between different ripeness stages - creating a reliable, consistent classification method that eliminates the subjectivity of human visual assessment.
The project utilizes a comprehensive dataset of 500 apple images (100 per ripeness level), providing a robust foundation for the machine learning model. The system's effectiveness demonstrates how texture analysis can provide high-accuracy classification even without relying on more resource-intensive deep learning approaches.
At the heart of the project is an interactive Streamlit dashboard that not only delivers real-time classification results but also visualizes the key texture features differentiating each ripeness stage. This makes the complex machine learning concepts accessible to agricultural professionals who may lack technical expertise in computer vision.
The initial dashboard design recalculated all features and classifications whenever a parameter was changed, causing significant performance lag that disrupted the user experience.
Implemented strategic caching mechanisms that store intermediate results and only recalculate when necessary. This optimization reduced response time from several seconds to near-instantaneous, creating a smooth interactive experience even when rapidly exploring different parameter combinations.
Creating intuitive visualizations that could effectively communicate complex machine learning concepts and results to non-technical stakeholders presented a significant challenge.
Developed a suite of interactive Plotly charts that allow users to explore the data and results from multiple perspectives. The visualizations include tooltips, color-coding, and interactive elements that make complex concepts like classification boundaries and nearest neighbors more accessible and intuitive.
Creating a dashboard that maintained usefulness and readability across different screen sizes proved challenging due to the complexity of the visualizations and control panels.
Utilized Streamlit's column system with dynamic width adjustments based on screen size. Implemented prioritized display logic that ensures critical visualizations are always visible while less essential elements adapt or reorganize based on available space, creating a consistent experience across devices.
The K-Nearest Neighbors algorithm, while conceptually simple, operates in a high-dimensional space that is difficult to visualize and understand for users without a machine learning background.
Developed a PCA-based visualization that projects the high-dimensional feature space onto two dimensions while preserving the relative distances between samples. This allowed users to visually understand how the algorithm makes classification decisions based on proximity to training examples.
The Apple Ripeness Classification system achieved an impressive 96% accuracy with optimal parameters (d=1, θ=45°, k=3), successfully distinguishing between five distinct ripeness levels (20%, 40%, 60%, 80%, and 100%). Particularly notable was the near-perfect classification for certain ripeness stages, especially the 20% and 60% ripeness categories.
Cross-validation testing confirmed the model's robustness, showing minimal variation across different data splits. This consistency demonstrates that the classification approach is stable and reliable, not merely benefiting from a fortuitous data distribution in the training set.
Beyond the technical achievements, this project has significant potential applications in agricultural sorting systems. By providing objective, consistent ripeness assessment, such a system could significantly reduce food waste through more precise harvest timing and optimized distribution planning based on ripeness levels.
Perhaps most importantly, this project successfully bridges the gap between advanced machine learning techniques and practical agricultural applications by creating an interactive tool that makes complex classification concepts accessible to non-technical stakeholders. This accessibility is crucial for the adoption of such technologies in traditional industries.
The following enhancements are planned for the next iterations of this project:
Explore the technical details and implementation of this project: