
This comprehensive sentiment analysis system examines public opinion on Indonesian internship programs (MSIB and Magang) by analyzing social media content. The project collects tweets mentioning internship programs from 2021-2024, processes the text data using specialized Natural Language Processing techniques for Indonesian language, and performs sentiment analysis using a state-of-the-art Indonesian language model.
At the core of this project is a robust data processing pipeline that handles the unique challenges of Indonesian text analysis, including specialized stopword removal and stemming designed for the Indonesian language. The sentiment analysis leverages a RoBERTa-based model specifically trained for Indonesian text classification.
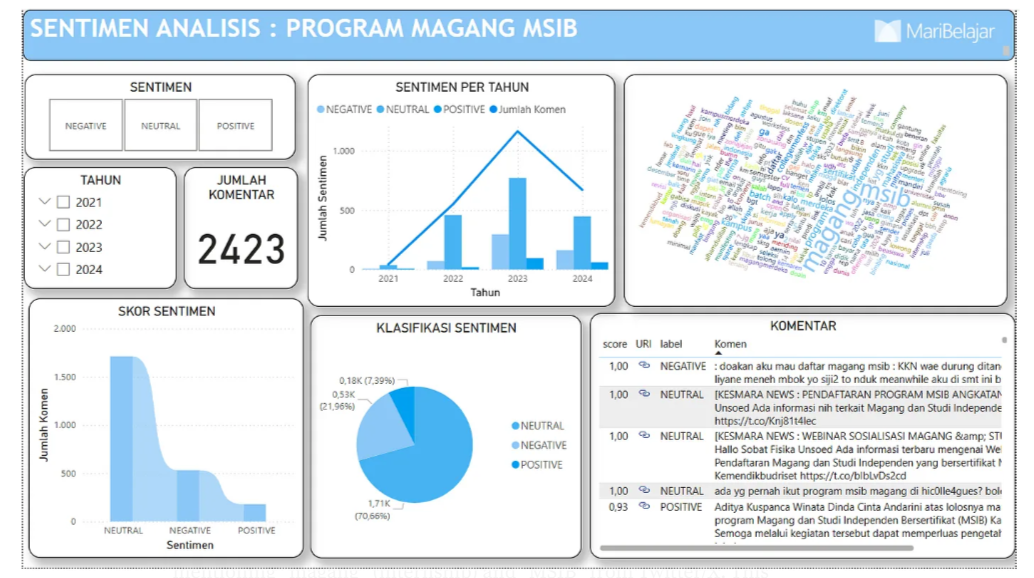
The results are visualized through an interactive Power BI dashboard that allows stakeholders to explore sentiment trends over time, identify common themes in positive and negative experiences, and track how public perception of these internship programs has evolved across multiple program cycles. This tool provides valuable insights for program administrators to identify strengths and areas for improvement.
Working with Indonesian text presented unique challenges due to limited availability of specialized NLP tools and resources compared to English language processing.
Combined multiple libraries (NLTK, Sastrawi) with a specialized Indonesian RoBERTa model to create an effective NLP pipeline suitable for Indonesian text analysis. This hybrid approach maximized the effectiveness of available tools while addressing language-specific requirements.
Social media text contained extensive slang, abbreviations, and mixed language (English-Indonesian), making standard NLP approaches less effective.
Created a robust preprocessing pipeline with custom normalization rules, specialized stopword lists, and Indonesian stemming to handle the informal nature of social media text. Implemented rules to handle common abbreviations and developed a custom dictionary of slang terms and their standard forms.
Integrating Twitter data with sentiment analysis results in Power BI required handling complex timestamp formats, special characters, and creating appropriate relationships for effective filtering.
Developed custom data transformation steps to convert Twitter timestamps, handle special characters, and create calculated columns for time-based filtering. Implemented a carefully designed data model with appropriate relationships to ensure effective cross-filtering across visualizations.
The text-heavy nature of the dataset created performance challenges in the dashboard, particularly when implementing complex filtering and visualizations.
Optimized dashboard performance through strategic data relationships, efficient DAX measures, and implementing incremental refresh policies. Created summarized tables for high-level visualizations while maintaining detailed data for drill-through functionality, balancing performance and analytical depth.
Needed to create an intuitive user experience that made complex sentiment analysis accessible to non-technical stakeholders.
Implemented slicers, drill-through functionality, tooltip pages, and consistent design principles to enhance user experience and data exploration. Created a guided navigation flow with clear visual cues and contextual help text to make the dashboard approachable for users with varying levels of analytical expertise.
The analysis revealed a sentiment distribution of 60% neutral, 25% positive, and 15% negative statements toward Indonesian internship programs. This balanced distribution provided valuable context for understanding public perception and identifying areas for program improvement.
Text analysis successfully identified positive keywords associated with internship experiences, including "learning experience," "skill development," and "networking." Conversely, the analysis pinpointed common pain points mentioned in negative contexts, such as "application process," "selection difficulty," and "workload." This keyword analysis helps program administrators understand specific strengths and weaknesses.
Temporal analysis revealed an encouraging trend of increasing positive sentiment from 2021 to 2024, suggesting that program improvements have been effective. Additionally, the analysis identified seasonal patterns in sentiment, with variations during application periods versus program completion phases.
The dashboard serves as an accessible tool for program administrators to identify strengths and improvement areas, providing data-driven insights to shape future program iterations and enhance the overall participant experience.
The project is being continuously enhanced with these planned improvements:
Explore the technical details and findings from this sentiment analysis project: